Watching Copilot's Prompt Cache with OpenTelemetry and Grafana
Open VS Code, ask Copilot Chat one question, and if you crack open the debug view you can watch prompt cache tokens tick past for that single call. That is exactly the amount of visibility one developer needs. It stops being enough the moment a platform team wants the same picture across a fleet, over a week, sliced by model and by prompt shape. That was the question I got pulled into last week. The customer had rolled Copilot out to a decent chunk of their engineering org, adoption was healthy, and they had shown up with a specific worry: how consistent are the prompts our developers are actually sending? They did not want a marketing chart. They wanted to see, per developer and per prompt shape, how often the model was reading from the prompt cache instead of building a new one. That number tells you a lot about how stable and reusable your prompts really are.
Prompt caching is one of those things that sounds boring until you start paying attention to what triggers a hit versus a miss. Cache reuse only kicks in when the same prompt prefix shows up again, and if your prompts drift a little each time (a slightly different system message, an unstable ordering of tools, a workspace hint that changes on every call), you can quietly torch your cache hit rate without noticing. Lower hit rates mean slower responses and less predictable behavior, so the customer had a hunch this was happening in their org and wanted proof one way or the other.
So I built a small thing to prove it locally: samueltauil/copilot-traces. Docker Compose brings up Grafana Tempo and Grafana, VS Code ships OTel traces straight at Tempo over OTLP/HTTP, and a pre-built dashboard shows cache_read vs cache_creation tokens over time. No cloud account, no collector, no signup. The whole point is that you can hand a laptop to a skeptical developer and have them running in about five minutes.
Why this works at all
The unlock is that recent VS Code versions already emit OpenTelemetry spans for Copilot chat. The GenAI semantic conventions cover the attributes I needed:
gen_ai.usage.input_tokensandgen_ai.usage.output_tokensfor the raw token counts.gen_ai.usage.cache_read.input_tokensfor cache hits.gen_ai.usage.cache_creation.input_tokensfor cache misses that got written into the cache.gen_ai.request.modelandgen_ai.operation.nameso I can slice by model and by whether a span is a chat, an invoke_agent, or an execute_tool call.
Cache hit is cache_read.input_tokens > 0. Cache miss is cache_creation.input_tokens > 0. Both zero means no cache involvement. Once you have those three states nailed down, everything else on the dashboard is just counting.
The moving parts
The stack in the repo is smaller than I expected it to be when I started. Tempo is configured to accept OTLP/HTTP directly on port 4318. Grafana points at Tempo as a data source. Grafana loads the dashboard from a provisioning file at boot. That is really it.
Turning on the client is four settings in VS Code user settings:
{
  "github.copilot.chat.otel.enabled": true,
  "github.copilot.chat.otel.exporterType": "otlp-http",
  "github.copilot.chat.otel.otlpEndpoint": "http://localhost:4318",
  "github.copilot.chat.otel.captureContent": false
}
One catch that cost me a while to figure out: it has to be User settings, not Workspace. The OTel SDK initializes early in VS Code startup, and workspace settings load too late for the exporter to pick them up. Reload the window after saving and traces start flowing.
I left captureContent off by default because when you flip it on the traces include the full prompts and responses. That is amazing for debugging your own prompts and terrifying for anyone else’s, so I made the default the safe one.
What the dashboard actually shows
I based the panel layout on the official GitHub Copilot Grafana dashboard and rewrote the queries in TraceQL so they run against Tempo instead of a Log Analytics workspace. The cache-focused panels are the ones I added, because that was the customer’s whole question:
- Cache Read vs Creation tokens over time.
- Per-model cache efficiency as bar gauges.
- Stat panels for total hits, misses, input tokens, and output tokens.
Around those, the usual suspects: operations over time, token consumption by model, model distribution as a pie chart, response duration by model, top tool calls, and a raw trace table for the last few agent runs.
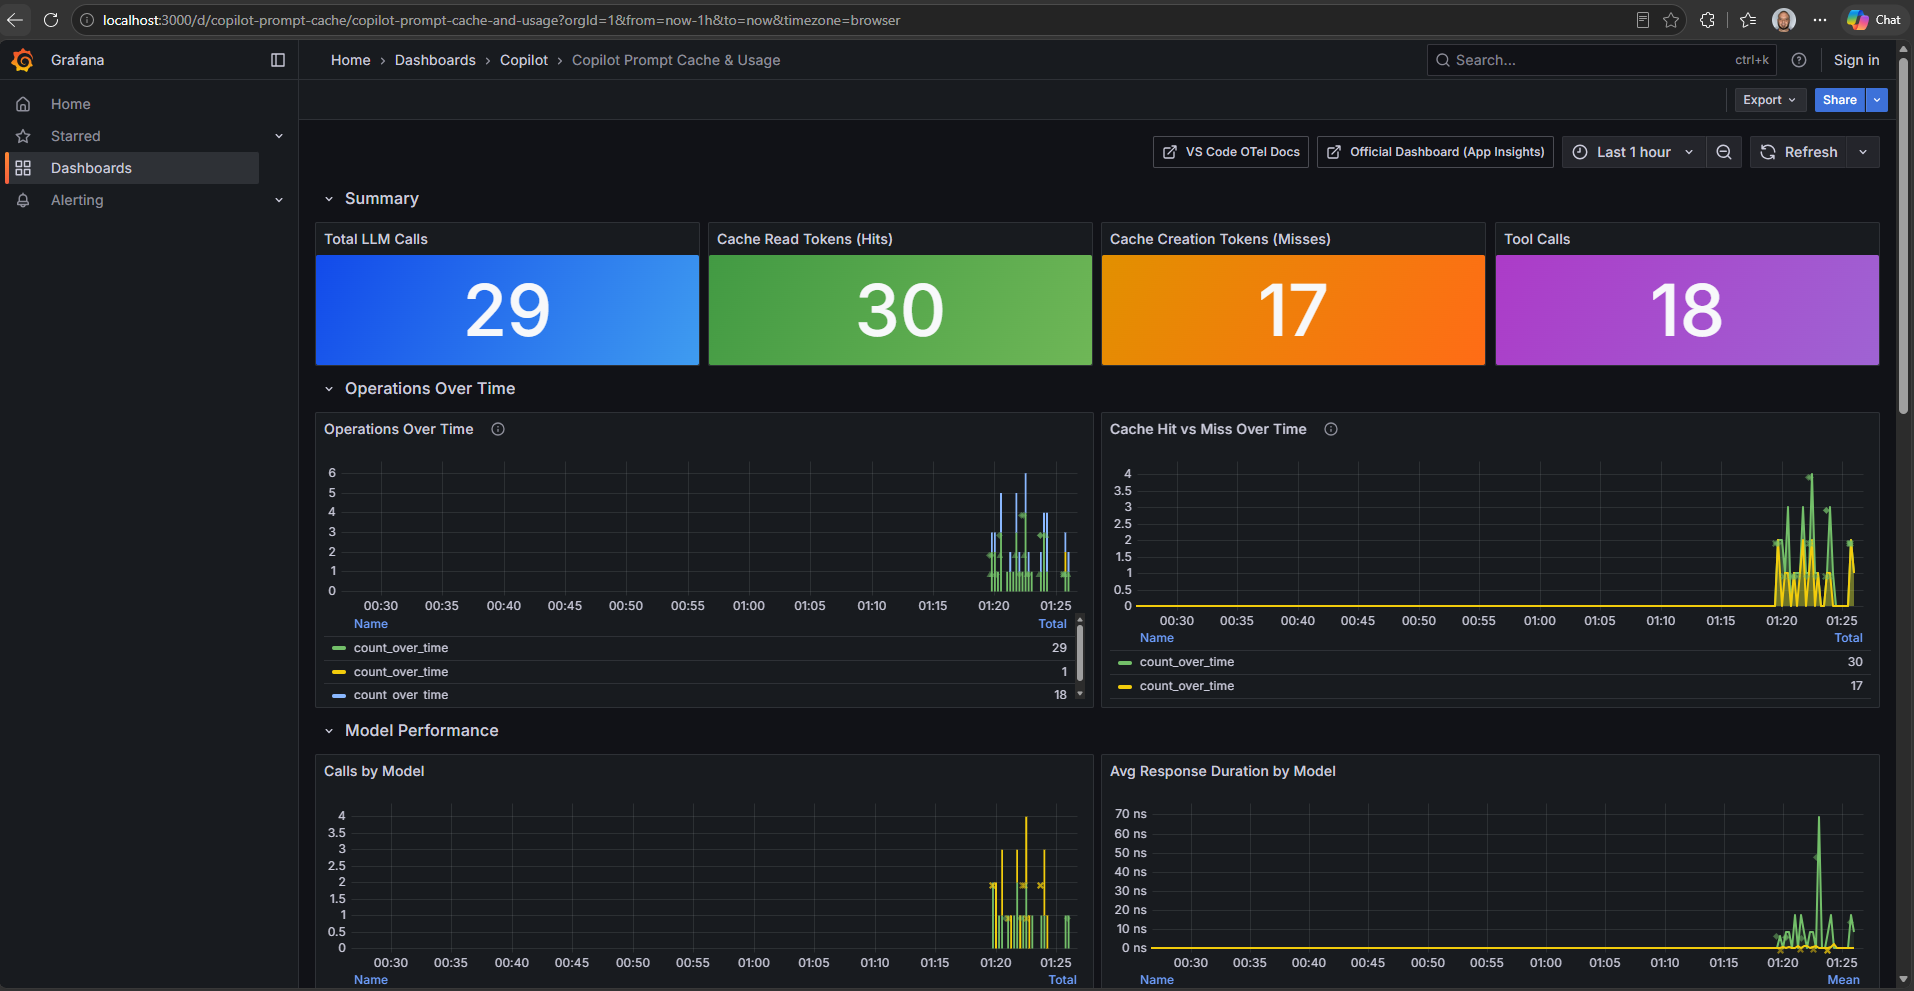
The first thing the customer wanted to do was open Explore, run a TraceQL query, and see actual spans. So the docs walk through that too. Two queries I keep going back to:
{ span.gen_ai.usage.cache_read.input_tokens > 0 }
{ span.gen_ai.operation.name = "chat" && resource.service.name = "copilot-chat" }
The first one is “show me every chat that hit the cache.” The second is “show me every chat span at all.” Between those two you can eyeball your hit rate on a laptop in about ten seconds.
Why no collector
Someone always asks this within the first minute of a demo, so it made it into the README as a big callout. Traces go directly from VS Code to Tempo because I wanted the demo to fit on one machine with no extra hops. It is easier to explain, and it is much easier to debug when something is not working.
That is not what I would ship to an org. In a team setting, you put an OTel Collector between the editor and the backend so you can fan out to more than one destination, filter attributes you do not want to send, and route different environments to different backends. The typical shape I sketch for customers is a Collector in front of both Grafana Tempo and Azure Application Insights, so the platform team gets its dashboards and the app teams keep their existing APM story.
The Intune question
This is the part that made the customer sit up. The four VS Code settings above are great for a demo, but if you are asking every developer to paste them into their own settings.json, half of them will forget and your metrics will be a lie. The fix is boring and effective: managed settings via Microsoft Intune. Push a policy that sets the OTel endpoint, the exporter type, and the enabled flag on every managed device, and now the telemetry is not opt in anymore. It just is.
The Microsoft guide on Grafana + Application Insights walks through the Collector, App Insights, and Managed Grafana side of that story. Pair it with an Intune policy for the client settings and you have the enterprise version of this same demo, running against the same conventions, with the same dashboard queries.
What the customer walked away with
The number that mattered to them was per-model cache efficiency. Once they had it, the conversation changed shape. It stopped being a vague sense that something felt inconsistent from run to run and became “which prompt shapes are killing our cache, and can we stabilize them.” That is a much better question to be arguing about, because you can actually do something with the answer.
A couple of small things they noticed that I had not framed as features:
- The dashboard runs on their laptop. Nobody had to file a ticket for a Grafana instance to try it.
- The queries are TraceQL, not KQL. Their platform team is already Grafana-heavy, so there was no new query language to learn.
- The client-side toggle is a single settings block. If it turns out to be a bad idea, you turn it off and reload.
If you want to poke at it
Clone the repo, docker compose up -d, paste the four settings into your user settings.json, reload VS Code, and use Copilot Chat for a few minutes. Then open http://localhost:3000 and the dashboard will already be there waiting.
Repo is here if you want the details: samueltauil/copilot-traces.
The thing I keep telling customers about this pattern is that observability for AI-assisted coding is not a special new discipline. It is the same OpenTelemetry story we have been telling for services, aimed at a slightly different audience. Once you can see the traces, the questions downstream about prompt tuning and usage patterns get a lot less handwavy.