Copilot Compass: Navigate Your GitHub Copilot Adoption with Actionable Insights
Measuring GitHub Copilot adoption across your organization can be challenging. While GitHub provides usage metrics through APIs, transforming that raw data into actionable intelligence requires additional tooling. That is where Copilot Compass comes in.
What is Copilot Compass?
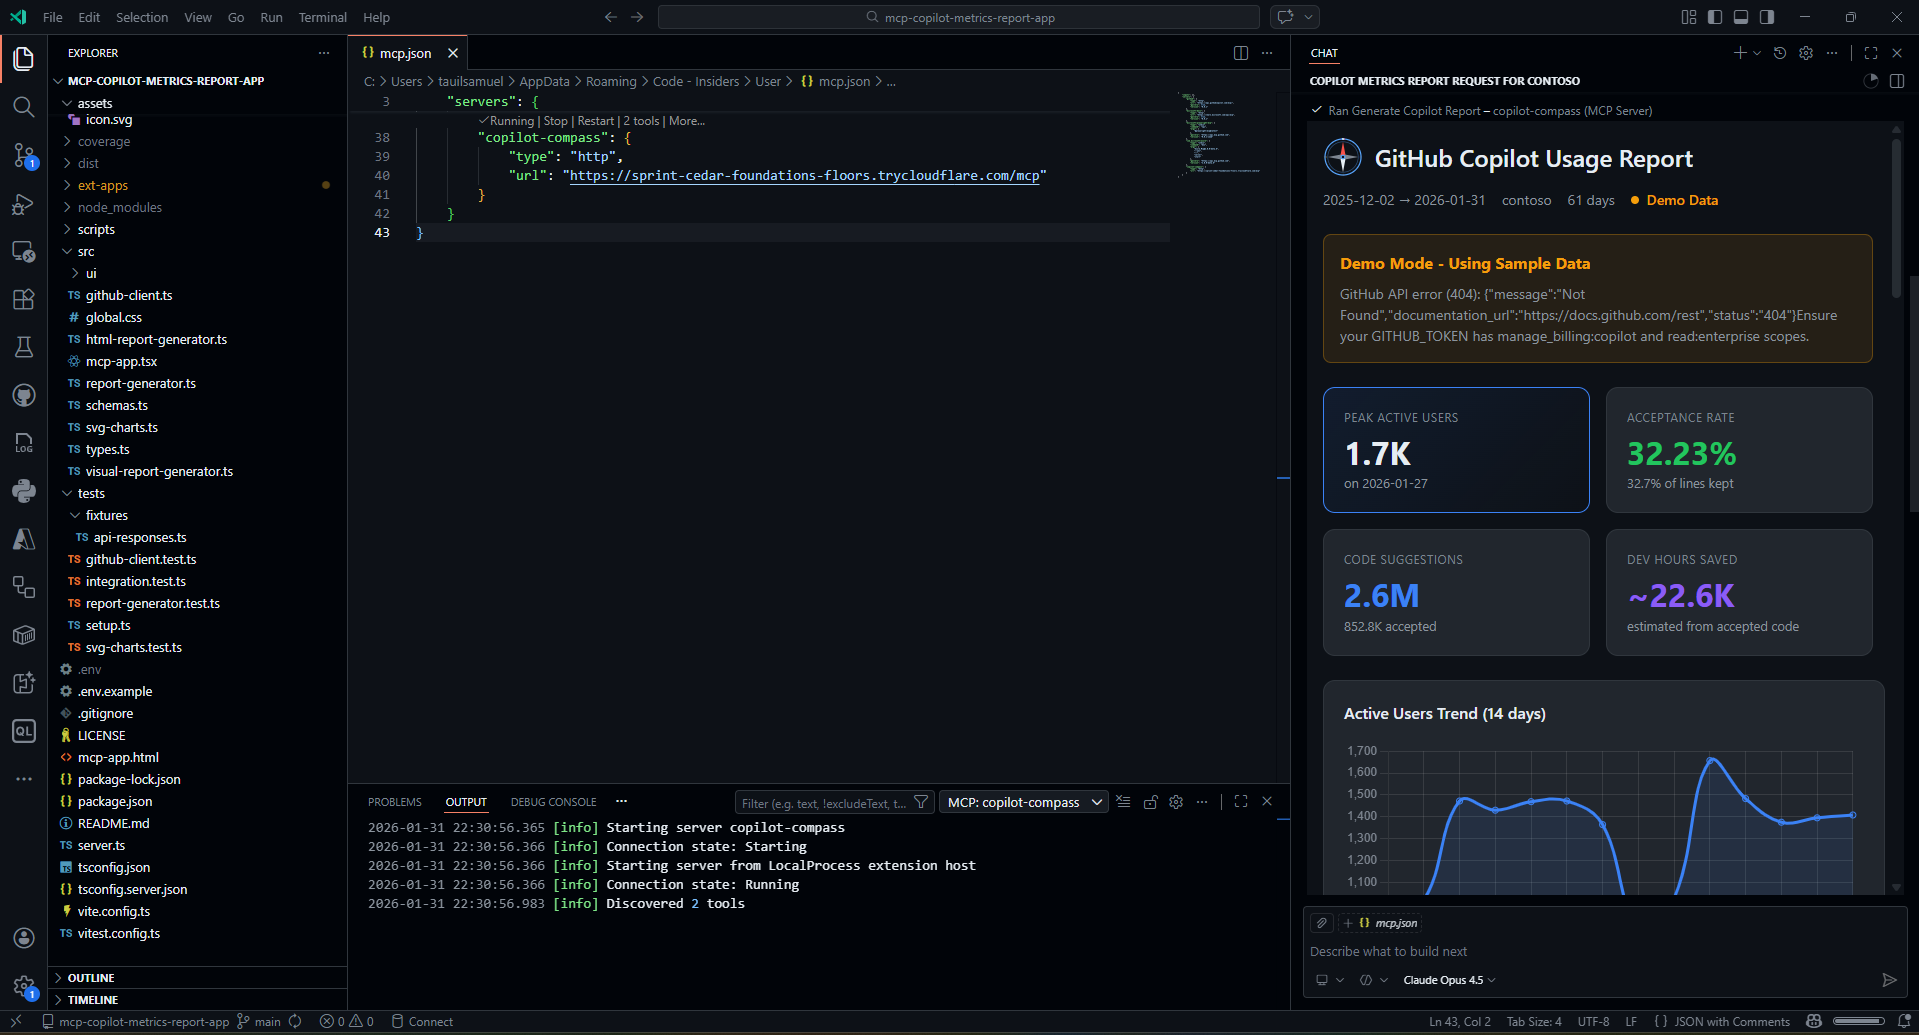
Copilot Compass is an MCP (Model Context Protocol) application that transforms raw GitHub Copilot metrics into an interactive visual dashboard. Built with the MCP Apps SDK, it provides both AI-readable data and a React-based UI that renders directly in MCP-compatible hosts like VS Code and Claude Desktop.
Key Differentiators
Unlike traditional dashboards, Copilot Compass leverages the MCP Apps SDK pattern:
- AI-First: Tools return structured data that AI models can analyze and summarize
- Visual Dashboard: The same tool invocation renders an interactive React UI in the host
- Real-Time Sync: The UI automatically updates when new data arrives via
ontoolresult - Host Theming: The dashboard adapts to the host’s color scheme via
useHostStyles
Key Features
Analytics Dashboard
The dashboard provides comprehensive analytics across several dimensions:
| Metric | What It Measures | Why It Matters |
|---|---|---|
| Active Users | Unique users who received Copilot suggestions | Adoption breadth |
| Engaged Users | Users who accepted at least one suggestion | Active value extraction |
| Acceptance Rate | Accepted suggestions divided by total suggestions | Quality of suggestions |
| Lines Accepted | Actual code lines integrated from Copilot | Productivity impact |
| Chat Sessions | Copilot Chat conversations initiated | AI pair programming usage |
| Code Insertions | Chat-generated code added to files | Conversational coding value |
| PR Summaries | Pull request descriptions auto-generated | Review process efficiency |
Visualizations
The dashboard includes multiple visualization types:
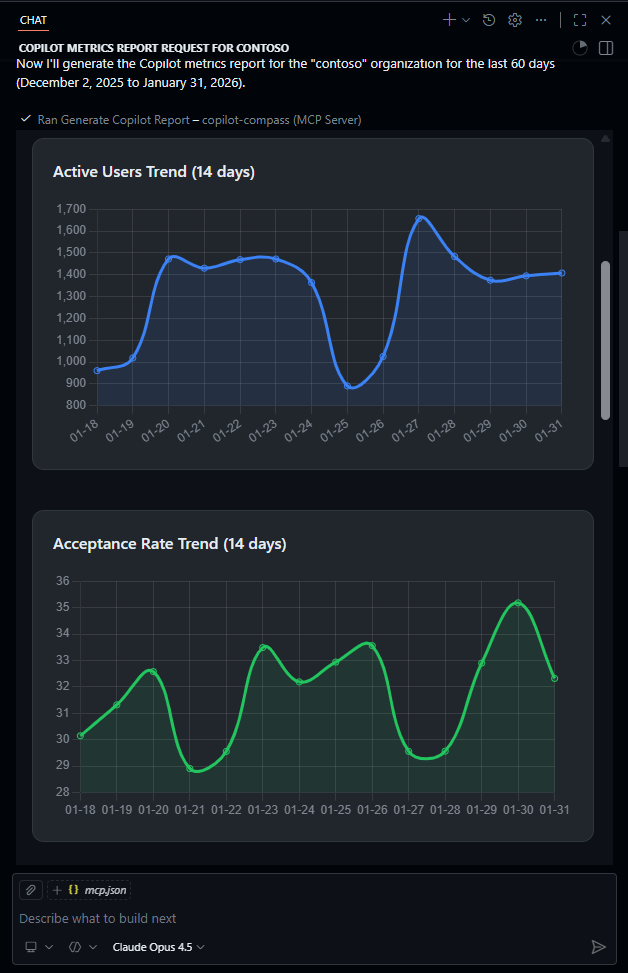
- Active Users Trend - 14-day line chart with daily active user counts
- Acceptance Rate - Track code suggestion acceptance over time
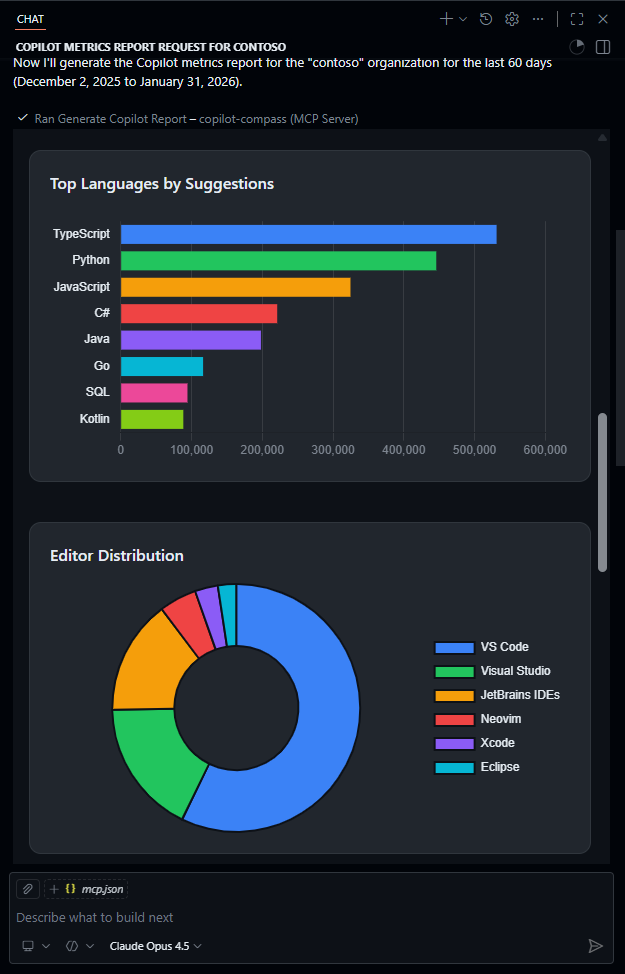
- Language Breakdown - Top languages by suggestions, acceptances, and engaged users
- Editor Distribution - Usage split across VS Code, JetBrains, Neovim, and more
- Chat Metrics - Sessions, code insertions, and copy events from Copilot Chat
- PR Intelligence - Pull request summary generation statistics
Getting Started
Prerequisites
- Node.js 18+
- VS Code Insiders - Required for MCP Apps SDK (interactive dashboard). Download here.
- GitHub PAT with scopes:
manage_billing:copilot- Access Copilot metricsread:enterprise- Enterprise-level accessread:org- Organization metrics
Installation
# Clone the repository
git clone https://github.com/samueltauil/copilot-compass.git
cd copilot-compass

# Install dependencies
npm install

# Configure environment
cp .env.example .env
# Edit .env and add your GITHUB_TOKEN
Build and Run
# Build the React dashboard and TypeScript server
npm run build

# Start the MCP server
npm start
The server starts at http://localhost:3001 with:
- MCP Endpoint:
http://localhost:3001/mcp - Health Check:
http://localhost:3001/health
Connecting to VS Code
Add to your MCP configuration in VS Code:
{
  "mcpServers": {
    "copilot-compass": {
      "type": "http",
      "url": "http://localhost:3001/mcp"
    }
  }
}
Alternatively, use the built-in command:
- Press
Ctrl+Shift+P(orCmd+Shift+Pon macOS) - Type “MCP: Add Server”
- Choose “HTTP” transport
- Enter a name:
copilot-compass - Paste the URL:
http://localhost:3001/mcp
Using Copilot Compass
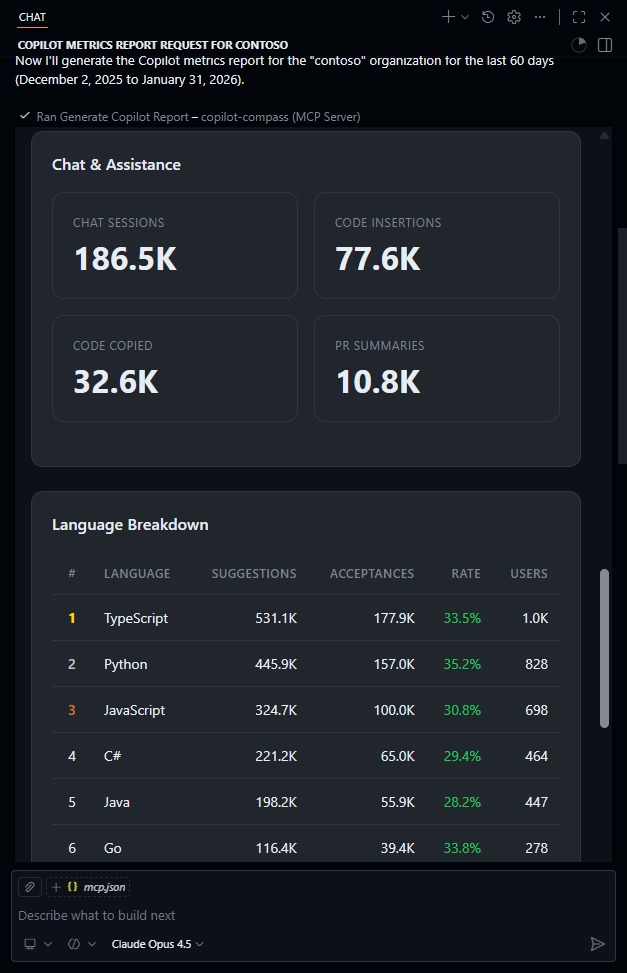
Once configured, open GitHub Copilot Chat and request a report:
Generate a Copilot report for enterprise "acme-corp" from 2024-01-01 to 2024-01-31
The AI will call the generate_copilot_report tool, which:
- Fetches metrics from the GitHub Copilot API
- Transforms the data into a structured report
- Returns JSON to the AI for summarization
- Renders the interactive dashboard in VS Code
Tool Parameters
| Parameter | Type | Required | Description |
|---|---|---|---|
enterpriseSlug |
string | Yes | Enterprise identifier |
orgName |
string | No | Organization within enterprise |
dateRange.from |
string | Yes | Start date (YYYY-MM-DD) |
dateRange.to |
string | Yes | End date (YYYY-MM-DD) |
Enterprise vs Organization Metrics
Copilot Compass supports fetching metrics at two levels, both using the same underlying data structure but with different scopes:
Enterprise Level (/enterprises/{enterprise}/copilot/metrics)
- Aggregates usage data across all organizations in the enterprise
- Requires a GitHub PAT with
manage_billing:copilotandread:enterprisescopes - Provides a holistic view of Copilot adoption across your entire company
- Best for executives and platform teams tracking company-wide adoption
Organization Level (/orgs/{org}/copilot/metrics)
- Scoped to a single organization
- Requires a GitHub PAT with
manage_billing:copilotandread:orgscopes - Useful for org admins tracking their team’s specific usage
- Best for team leads and department-level reporting
Both levels return the same metrics structure:
| Metric Category | Data Included |
|---|---|
| Code Completions | Suggestions, acceptances, lines of code, acceptance rate |
| Language Breakdown | Per-language statistics (TypeScript, Python, etc.) |
| Editor Distribution | Usage by IDE (VS Code, JetBrains, Neovim) |
| IDE Chat | Chat sessions, code insertions, copy events |
| Dotcom Chat | GitHub.com Copilot Chat usage |
| Pull Requests | PR summary generation statistics by repository |
To use organization-level metrics instead of enterprise, simply provide the orgName parameter:
Generate a Copilot report for organization "my-team" from 2024-01-01 to 2024-01-31
Architecture
The application follows a typical MCP Apps pattern with tool-UI binding:
┌──────────────────────────────────────────────────────────────────────────┐
│                    MCP HOST (VS Code / Claude Desktop)                   │
├──────────────────────────────────────────────────────────────────────────┤
│                                                                          │
│   ┌────────┐      ┌────────────┐      ┌──────────────────────────────┐   │
│   │  USER  │ ───► │  AI MODEL  │ ───► │   COPILOT COMPASS SERVER     │   │
│   └────────┘      └────────────┘      └──────────────────────────────┘   │
│                          │                          │                    │
│                          │                          │                    │
│                          ▼                          ▼                    │
│                   ┌─────────────┐          ┌────────────────────┐        │
│                   │ AI SUMMARY  │          │   REACT DASHBOARD  │        │
│                   │             │          │                    │        │
│                   │ - Insights  │          │  - useApp() hook   │        │
│                   │ - Trends    │          │  - Chart.js viz    │        │
│                   │ - Actions   │          │  - Host theming    │        │
│                   └─────────────┘          └────────────────────┘        │
│                                                                          │
└──────────────────────────────────────────────────────────────────────────┘
                                      │
                                      │ Fetches metrics
                                      ▼
                           ┌──────────────────────┐
                           │     GITHUB API       │
                           │  /copilot/metrics    │
                           └──────────────────────┘
How It Works:
- User Request: The user asks for a Copilot report in natural language via GitHub Copilot Chat
- AI Processing: The AI model parses the request and calls the
generate_copilot_reporttool with the appropriate parameters - Data Fetching: The Copilot Compass server fetches usage metrics from the GitHub Copilot API
- Dual Response: The server returns structured JSON data that:
- The AI model receives and summarizes into actionable insights
- The React dashboard renders as interactive visualizations
- User Experience: The user sees both the AI’s natural language summary and the visual dashboard side by side
Key Components
Server Side (server.ts):
import { registerAppTool, registerAppResource } from "@modelcontextprotocol/ext-apps/server";

// Register the tool with UI metadata
registerAppTool(
  server,
  "generate_copilot_report",
  {
    title: "Generate Copilot Report",
    description: "Generate a comprehensive Copilot usage report",
    inputSchema: reportInputSchema.shape,
    _meta: { ui: { resourceUri } },
  },
  async (args) => {
    const report = await generateReport(args);
    return {
      content: [{ type: "text", text: JSON.stringify(report) }],
    };
  }
);
Client Side (mcp-app.tsx):
import { useApp, useHostStyles } from "@modelcontextprotocol/ext-apps/react";

function CopilotCompassApp() {
  const [report, setReport] = useState(null);

  const { app, error } = useApp({
    appInfo: { name: "Copilot Compass", version: "1.0.0" },
    onAppCreated: (app) => {
      app.ontoolresult = async (result) => {
        const data = JSON.parse(result.content[0].text);
        setReport(data);
      };
    },
  });

  // Apply host theme styles
  useHostStyles(app);

  // Render dashboard with Chart.js visualizations
}
Running in GitHub Codespaces
For the quickest setup, use GitHub Codespaces:
![]()
When your Codespace starts:
- Dependencies are installed and the project is built
- The MCP server starts automatically on port 3001
- Port 3001 is made public with HTTPS
- MCP config is created automatically
MCP Apps SDK and VS Code Compatibility
The interactive dashboard UI relies on the MCP Apps SDK, which is currently only supported in VS Code Insiders. The Codespaces web editor uses VS Code Stable, which supports basic MCP tools but does not yet render the visual dashboard UI.
Your options:
-
Connect from VS Code Insiders Desktop (recommended for full UI): Install VS Code Insiders locally, add the GitHub Codespaces extension, and connect to your Codespace from there.
-
Use Codespaces web editor (tools only): The MCP tools will work and return JSON data that the AI can summarize, but the interactive React dashboard will not render.
MCP Apps SDK support is expected to ship in VS Code Stable in a future release. For the latest updates on MCP support in VS Code, see the official MCP documentation and the MCP Apps SDK repository.
Exposing Publicly with Cloudflare Tunnel
For remote access or sharing, you can expose the local server using Cloudflare Tunnel.
Quick Method
The project includes a convenience script that starts both the server and tunnel:
npm run public
This command builds the project, starts the MCP server, and creates a Cloudflare tunnel in one step.
Manual Method
If you prefer to run the steps separately:
# Install cloudflared
winget install cloudflare.cloudflared  # Windows
brew install cloudflared                # macOS

# In one terminal, start the MCP server
npm start

# In another terminal, create the tunnel
cloudflared tunnel --url http://localhost:3001
Cloudflared outputs a public URL like https://random-words.trycloudflare.com. Use this in your MCP client config:
{
  "mcpServers": {
    "copilot-compass": {
      "type": "http",
      "url": "https://random-words.trycloudflare.com/mcp"
    }
  }
}
Configuring in VS Code via Command Palette
Once you have the tunnel URL, you can add the MCP server directly from VS Code:
- Press
Ctrl+Shift+P(orCmd+Shift+Pon macOS) to open the Command Palette - Type “MCP: Add Server” and select it
- Choose “HTTP” as the server type
- Enter a name for the server:
copilot-compass - Paste your tunnel URL with the
/mcppath:https://random-words.trycloudflare.com/mcp - Press Enter to confirm
VS Code will add the server to your MCP configuration and it will be available in GitHub Copilot Chat immediately.
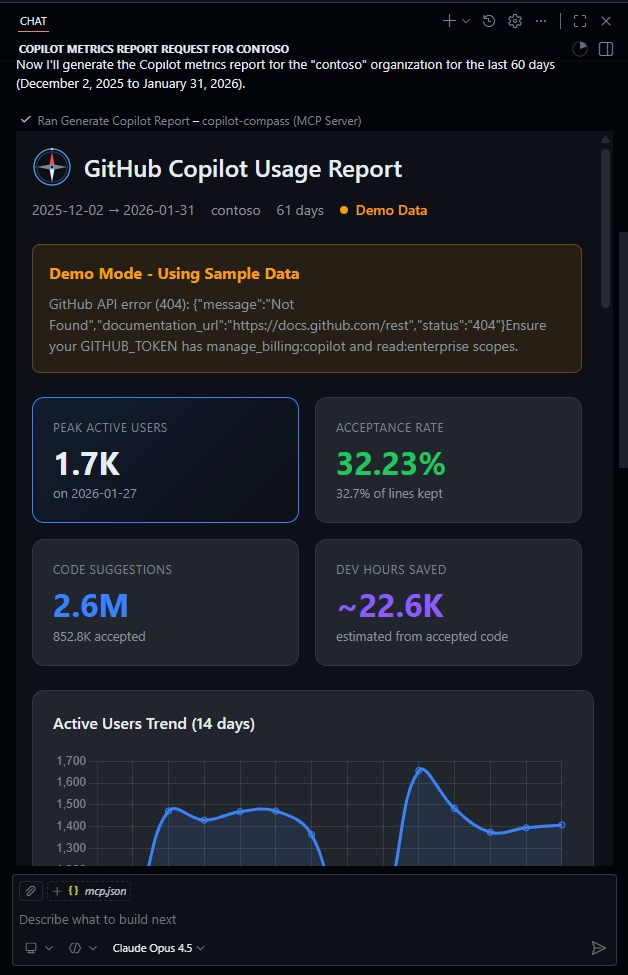
Demo Mode
If you do not have a GitHub token with the required permissions, Copilot Compass automatically falls back to demo mode with realistic mock data. This allows you to explore the dashboard and understand its capabilities without needing enterprise-level access.
Key Takeaways
-
Copilot adoption metrics are valuable - Understanding how your team uses Copilot helps optimize its deployment and identify training opportunities.
-
MCP Apps enable rich UIs - Beyond text responses, MCP servers can provide interactive visual components that render directly in the host application.
-
AI and visualizations work together - The AI summarizes insights while the dashboard provides detailed exploration capabilities.
-
Multiple deployment options - Run locally, in Codespaces, or expose publicly with tunneling services.
Resources
Have questions or want to contribute? Check out the GitHub repository!