Five models ran one turn, and I wanted to see all five
I turned HydraFusion on the week it shipped, gave it a real task in a small Python project, and waited about a minute. It came back with a good answer and one number: 14.72 credits. That is when I got curious. One model produced that, or four? Did something get drafted, reviewed, and improved along the way? The announcement says a turn can draft, critique, revise, or escalate, and that the CLI holds intermediate drafts so unfinished work does not look final. That is a sound call for the person doing the coding, because a draft that is about to be revised should not read as an answer. It also means the interesting part of the story happens off screen, and I wanted to watch it.
That is the itch. HydraFusion picks one of three execution patterns per request: single, where one model solves the task; cascade, where an efficient model drafts and a quality gate decides whether to accept or escalate; and critique, where one model drafts, a read-only critic from another family reviews, and the drafter revises once. Cascade and critique are the ones I wanted to see, because in both a second model contributed and the result still arrives as one clean answer. I wanted to know which model drafted, which one reviewed, what verdict came back, and where the credits went.
So I built samueltauil/hydrafusion-traces: docker compose up -d, point the CLI at it, and every turn shows up in Grafana with one span per fusion leg, named for the model that ran it.
This is an independent side project. It is not affiliated with, endorsed by, or supported by GitHub or Microsoft. HydraFusion is a research preview, and everything below was observed from the outside on one machine over 24 turns. It reads session state that carries no compatibility promise, so it will go out of date. Nothing here is a benchmark or a statement about model quality.
I assumed OpenTelemetry would just tell me
My first plan was the obvious one, and it was wrong.
I had already done a version of this for prompt caching in copilot-traces, so I assumed the same trick would work. The CLI emits OpenTelemetry, I would set OTEL_EXPORTER_OTLP_ENDPOINT, the fusion legs would show up as separate chat spans with different gen_ai.response.model values, and I would point Tempo’s span-metrics generator at that attribute. I budgeted an evening for the whole thing.
The CLI emits OTel correctly, and that is precisely why my plan did not work. Each turn arrives as exactly one chat operation with gen_ai.request.model=hydrafusion, which is what the GenAI semantic conventions ask for, because gen_ai.request.model is defined as the model the client asked for, and the client did ask for hydrafusion. There is no per-leg gen_ai.response.model because the conventions have no notion yet of a router that expands one request into several model calls. This is a gap between a developing spec and a new architecture, not a defect in the CLI. The vocabulary simply has not been written yet.
My span-metrics generator, had I left it running, would have produced one beautiful time series labelled hydrafusion. I disabled it and went looking somewhere else.
Where the detail actually lives
The CLI already writes all of it down, for its own good reasons.
Every session keeps a ~/.copilot/session-state/<id>/events.jsonl file, and that file records the routing pattern, the phase plan, the model that served each phase, the reviewer’s verdict, per-phase tokens, and per-phase credits. It is there so the CLI can resume and rewind a session, which is a genuinely nice feature and the reason this data is as complete as it is. The tailer in this repo reads the same file for a second purpose: it rebuilds each turn as a trace with one child span per leg and counts the same events into Prometheus.
That is the whole trick. Everything else in the repo is provisioned config: a collector, Tempo, Prometheus, and a Grafana dashboard that loads as the home page with no login and no datasource setup. The tailer is stdlib Python with no dependencies, because a thing that reads your session state should be small enough to read yourself.
Worth saying who wrote it. The contributor list on that repo has two entries, me and Copilot. I did the spike by hand, because working out what the CLI emits meant reading raw JSON lines and arguing with myself about what they meant. Everything after that was the kind of work I am glad to hand off: the tailer, the compose file, and several hundred lines of Grafana dashboard JSON that I would have gotten bored of halfway through. I ran most of it on GPT-6 Astra, which was my first proper session with that model, and the thing I noticed was how little I had to re-explain the topology. Which container talks to which port stayed put across sessions. The most recent pull request in the repo is a Copilot one that went and stripped an obsolete HYDRAFUSION_ROLLOUT feature flag out of the docs once the rollout opened up and the flag stopped being necessary. That is a small, boring, genuinely useful piece of maintenance, and I did not have to notice it myself.
docker compose up -d
export OTEL_EXPORTER_OTLP_ENDPOINT=http://localhost:4318
copilot --model hydrafusion
You need Copilot CLI 1.0.83 or newer with /experimental on, then HydraFusion selected from /model. If you want to look around without any of that, docker compose --env-file demo.env up -d replays a scrubbed cascade checked into fixtures/.
One line per turn in the tailer logs tells you it is working:
INFO fusion fusion-fa51fa07-905f pattern=cascade phases=3 models=gpt-5.6-sol,mai-code-1.1-flash aiu=14.72
The 14.72 turn, taken apart
Here is the turn from the top of this post, as three legs.
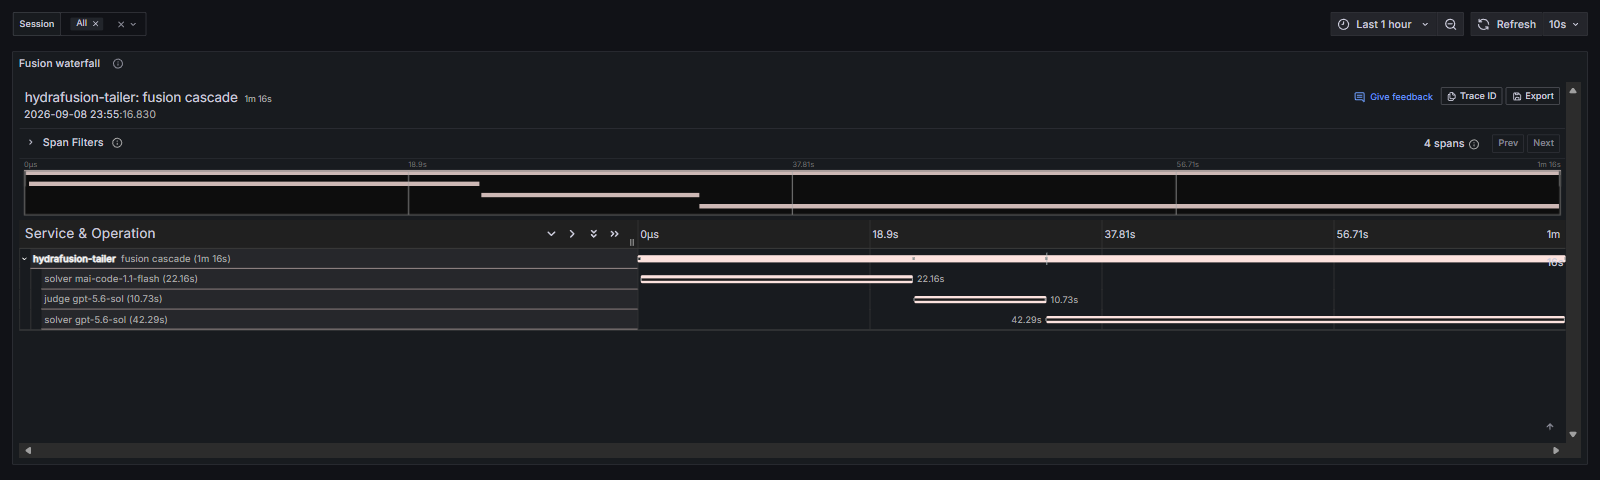
mai-code-1.1-flash drafted for 22 seconds and 0.58 AIU, the credit unit the CLI reports. gpt-5.6-sol reviewed that draft, returned reject, and then redid the work itself in 42 seconds and 11.69 AIU. The judge leg cost 2.46. Three legs, one coherent answer, and now I can see all three.
Open any leg and the whole story sits on two attribute rows.
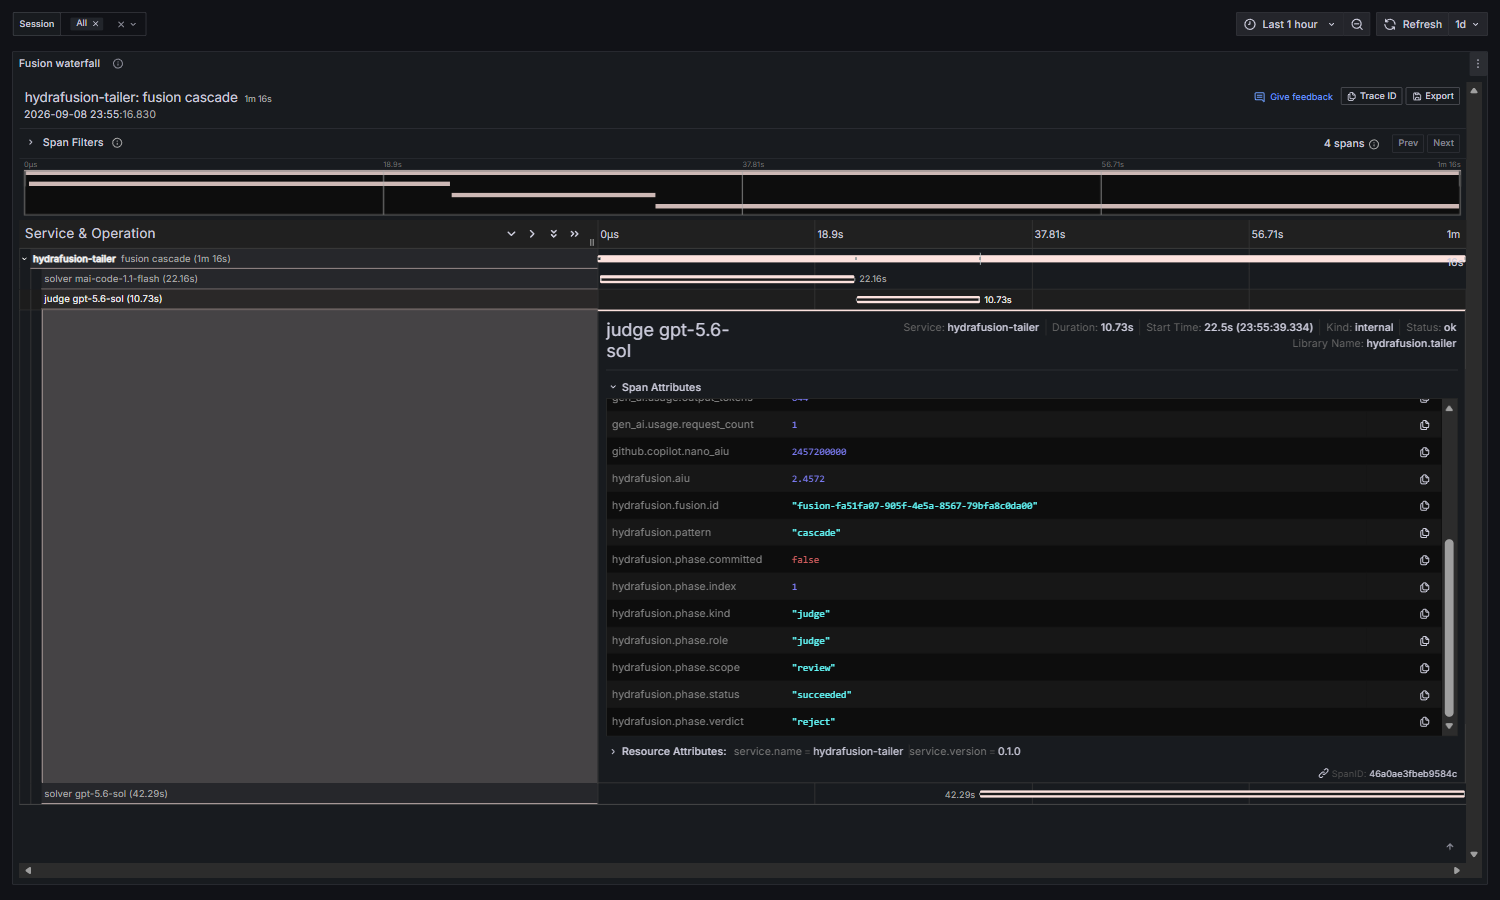
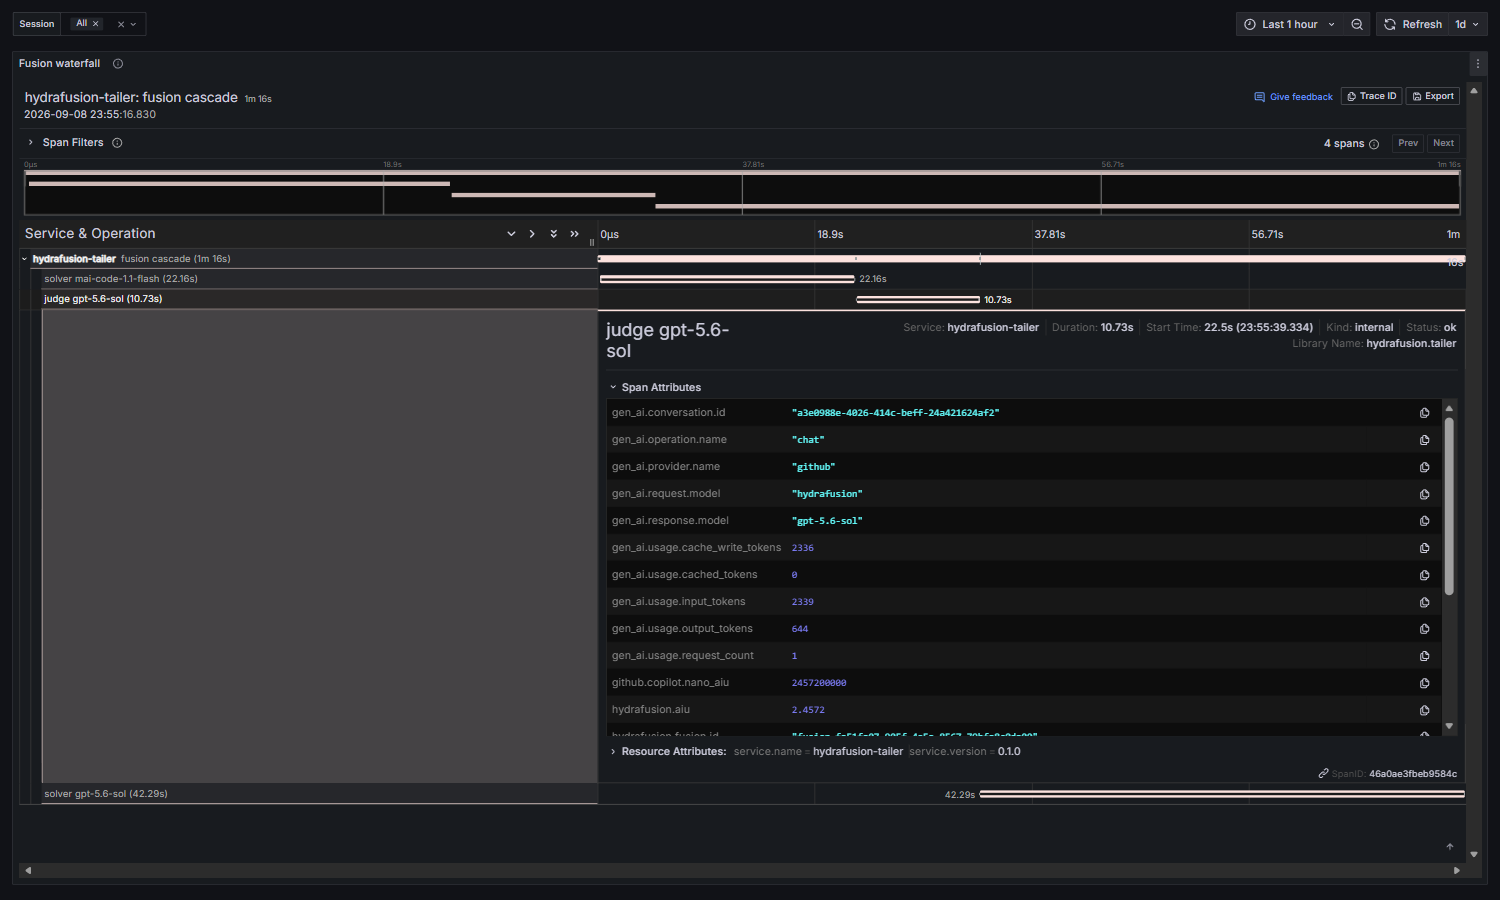
gen_ai.request.model is hydrafusion, per the conventions. gen_ai.response.model is gpt-5.6-sol, which the tailer added from the session log. Both are true statements. That is the mental model I keep coming back to: the conventions assume one request maps to one model, and a router breaks that assumption without breaking any rule. The model you asked for and the model that answered are now two separate things, and the spec only has a field for the first one.
The rest of the leg carries the verdict, the token split, the credit cost, and a flag for whether this leg produced the answer you actually received.
The cascade gamble goes both ways
I wrote an early version of the findings doc when I only had four turns, and I confidently claimed every cascade ended in rejection. At 24 turns it is two out of three, and the third one is more interesting than the two that confirmed my bias.
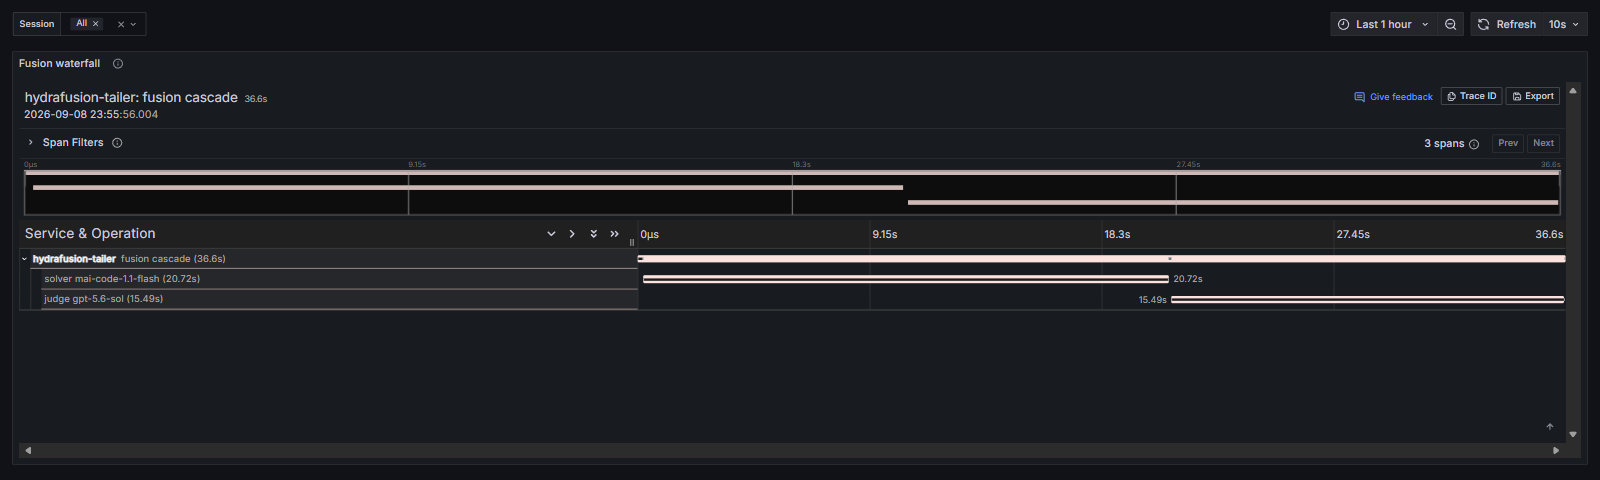
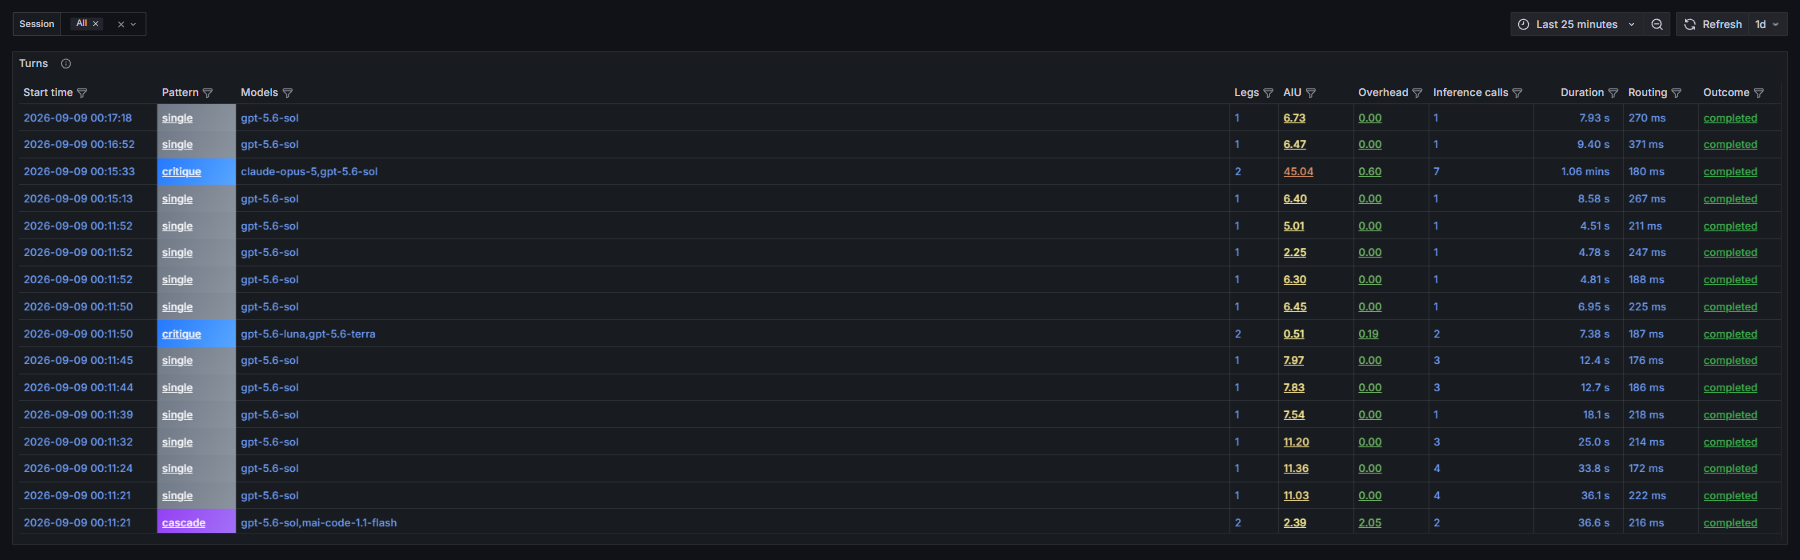
mai-code-1.1-flash answered an open-ended distributed-cache design question for 0.34 AIU. gpt-5.6-sol reviewed it and accepted. Total for the turn: 2.39 AIU, against a median of 7.97 for single turns in the same sample.
Look at the internal split, though. The review cost 2.05 and the answer cost 0.34. The check cost six times the work it approved, and the turn still landed at roughly a fifth of a comparable single-model turn. I find that genuinely hard to have a clean opinion about. Most of the spend went on checking rather than producing, and the result was both verified and cheaper than the alternative.
Critique is a different animal
Cascade and critique both include a review phase, which makes it tempting to file them under one heading. The traces say otherwise.
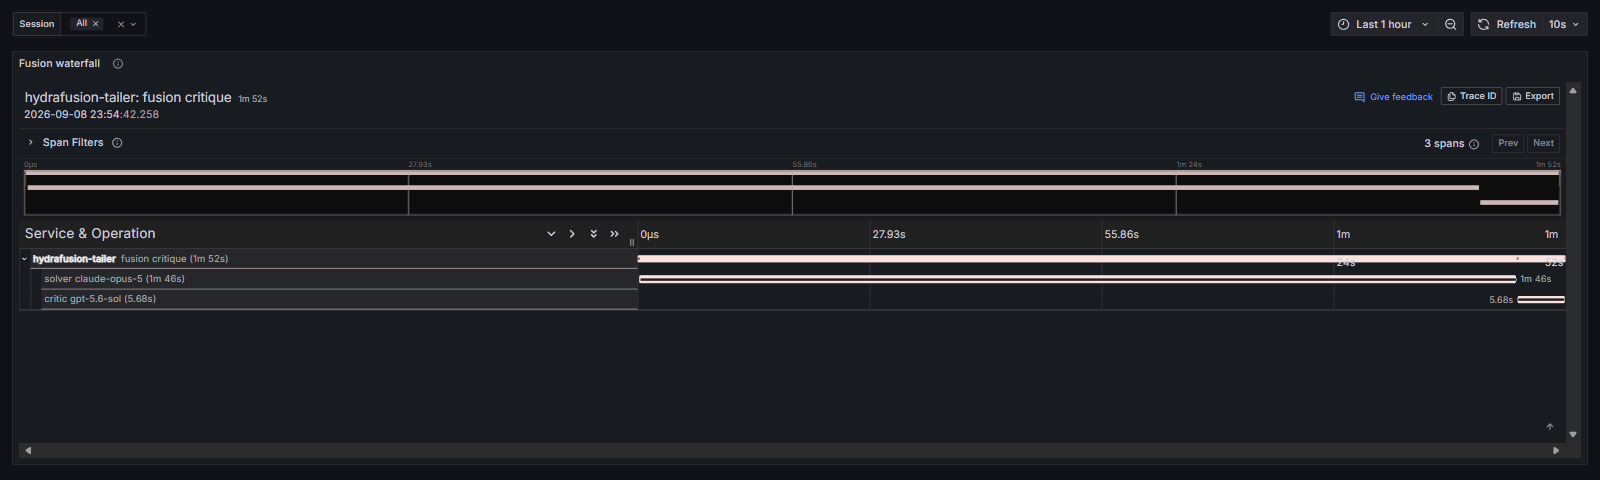
claude-opus-5 drafted for 1 minute 46 seconds and 51.11 AIU. gpt-5.6-sol critiqued it for 5.7 seconds and 0.69 AIU. There is no verdict field, and the draft is committed.
So in a critique the review is a cheap pass over expensive work. In a cascade the judge is a gate that can trigger a second full attempt on a stronger model. The cost profiles run in opposite directions even though both patterns include a review phase. If you are building a cost model for this, averaging them into one “multi-model” bucket will hide the thing you most want to know, which is how often the gate fires.
What twenty-four turns looked like
Small sample, one machine, one operator, one little Python project with a seeded off-by-one bug. Read it as a field report, not an evaluation.

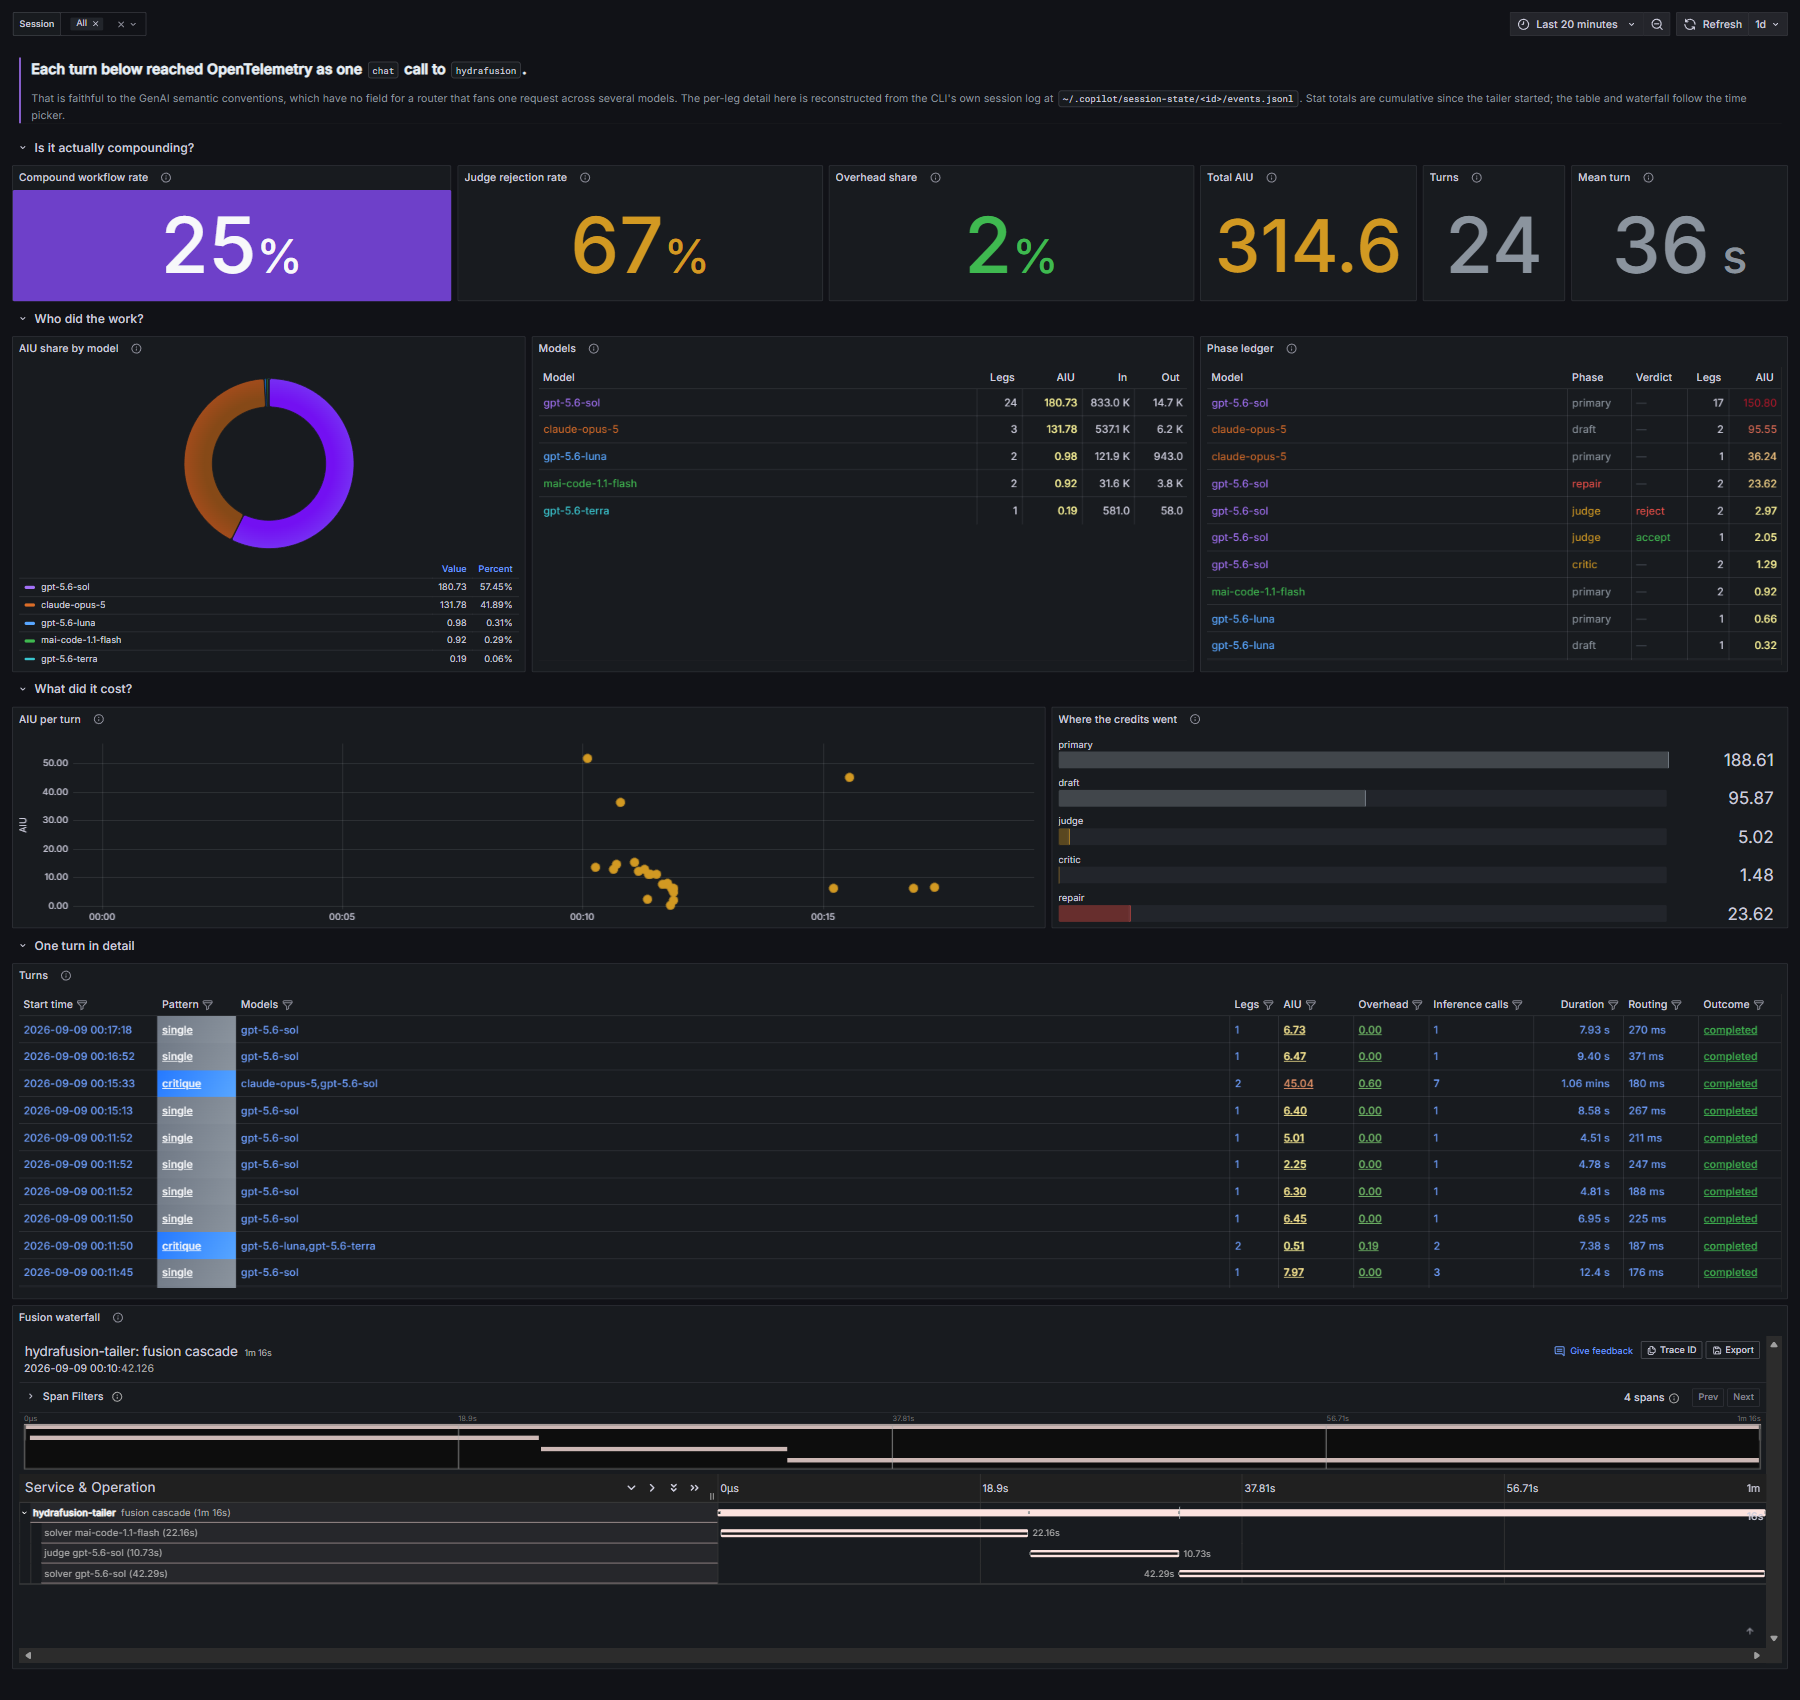
Six of 24 turns used more than one model, so a 25% compound rate. Eighteen turns had no second leg at all, which is the router deciding a single model was enough and saving the rest. Judge rejection rate was 67%, though that is two out of three and not a number I would defend anywhere. A rejection is the quality gate doing its job: the draft did not clear the bar, so the turn escalated, which is exactly the behaviour the pattern is there to provide.
Five distinct models showed up across the set.
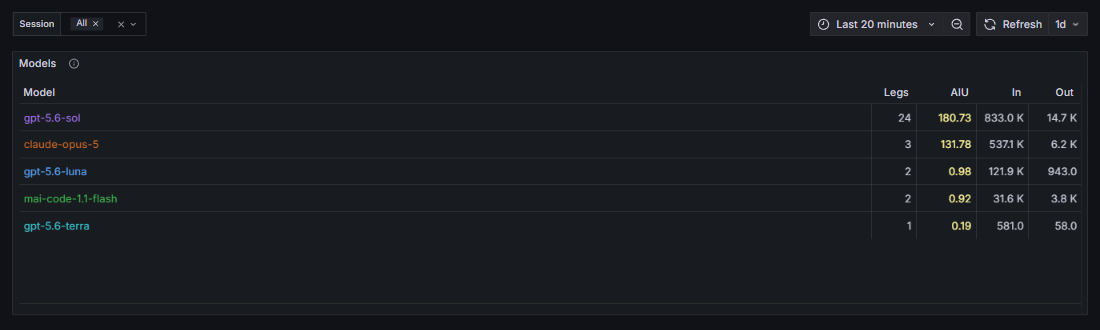
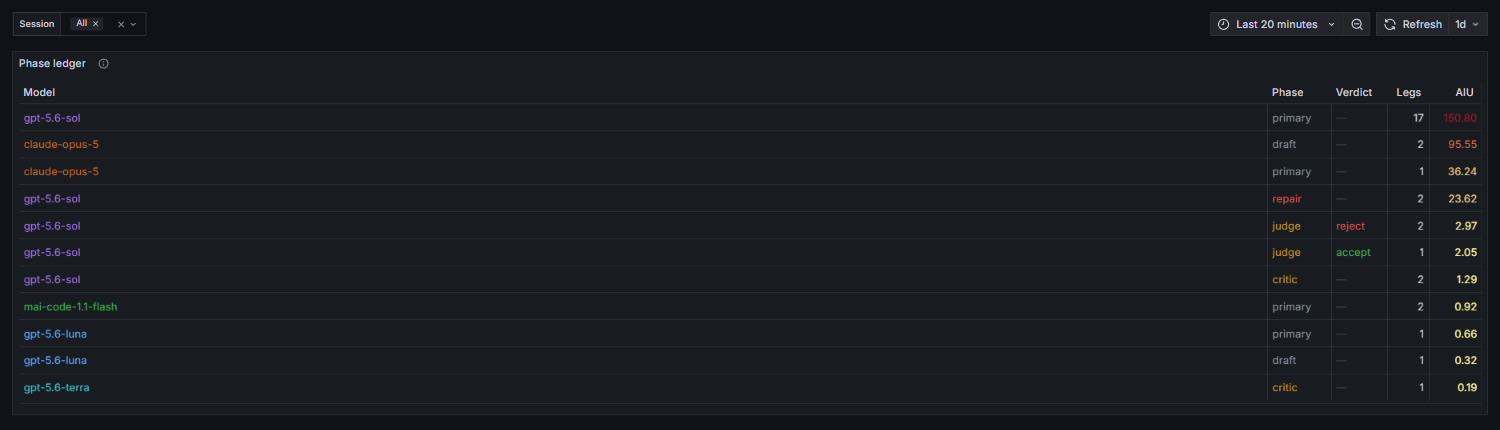
gpt-5.6-sol ran a leg in every single turn. claude-opus-5 appeared three times, only for the heaviest work: multi-file refactors and a delete-and-verify pass.
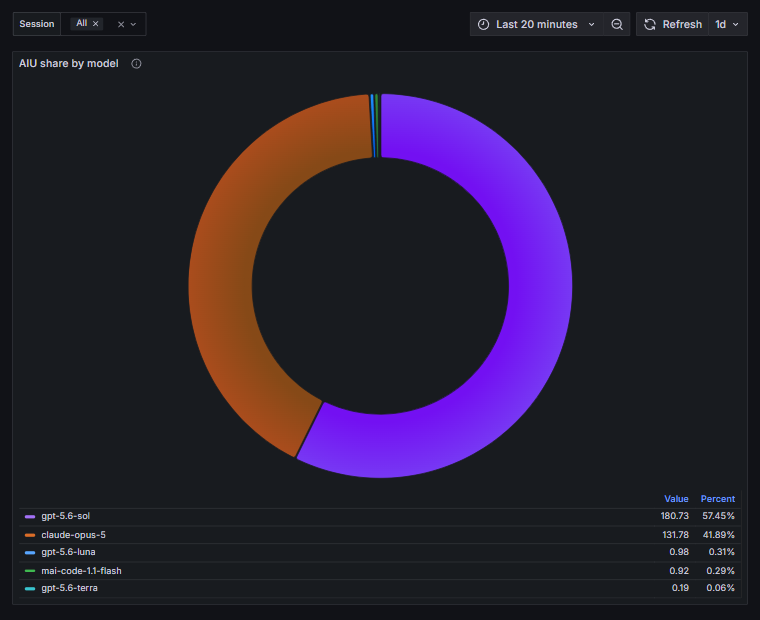
Those three claude-opus-5 legs took 42% of total spend. Treat the identifiers as routing labels observed in a preview rather than product names, because they will change, and the leaderboard reading of that chart is meaningless at this sample size. The point is that the pool is heterogeneous across vendors and the router reaches into it per phase, not per session.
Every leg the router ran, coloured by model and phase kind:
And the answer to the question I actually cared about, which is how the credits split between the leg that answered and the legs that reviewed:
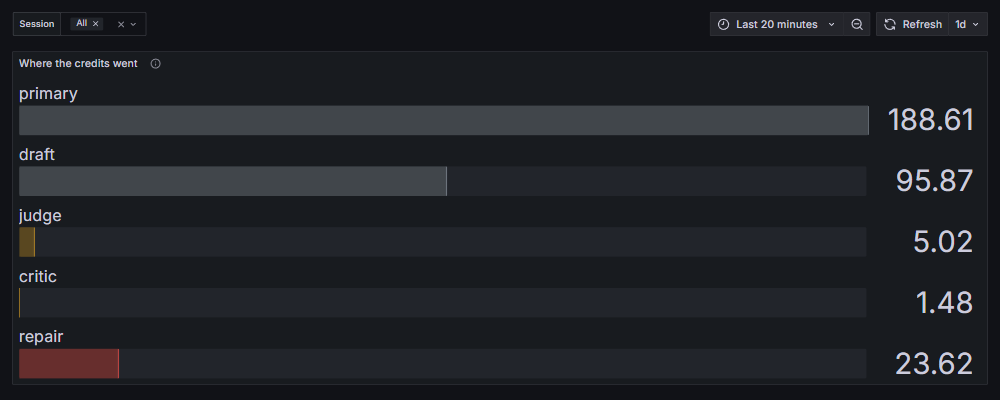
One leg per turn supplies the answer you see. Across all 24 turns, the legs that did not amounted to 2.5% of spend. I hesitate to call that overhead, because a superseded draft and its critique sit in the repair leg’s context, so the final answer may well be better for their existence. What that 2.5% actually measures is the share of the bill that bought review instead of output, which is a duller sentence but a more defensible one.
Then one row per turn, and clicking any cell loads that turn’s waterfall.
I guessed the route right once in six tries
Before running the prompts I wrote down what I expected each one to route to. My rule was the sensible one: cheap draft for easy work, strong model for hard work, escalate when the draft is weak.
I got one out of six. A three-item stdlib lookup went to critique across two models for 0.51 AIU. A subtle off-by-one with a failing test, exactly the kind of thing I expected to trigger a cascade, went straight to single on the strongest model. A mechanical rename across two files became a cascade. I was wrong in both directions and at both ends of the difficulty range.
That does not mean the routing is arbitrary. routeSource was capi_plan in all 24 turns and policy was max, which means the decision is served remotely and can be retuned without a CLI release. Pattern selection took between 172 and 371 milliseconds, a mean of 229 ms, well under 1% of the 28 to 64 second wall times. There is a degradedReason field that stayed null throughout, so there is a fallback path I never triggered.
Two other things surprised me. Across 96 inference calls, input tokens outweighed output roughly 59 to 1, and three quarters of that input was served from cache, which is a lot of reuse. Visible output is a poor proxy for cost here. A short reply on a cold cache can easily cost more than a long one, which explains an oddity in the turns table I stared at for a while before the token numbers made sense of it.
What will break, and when
events.jsonl is session state, not an API. It is there so the CLI can resume and rewind, and it carries no compatibility promise, nor should it. Everything here was verified against Copilot CLI 1.0.84-2. When the tailer stops producing rows after a CLI upgrade, that is the reason, and it is the expected outcome of reading someone’s internal state for fun. Attribute names will move too, because the GenAI conventions are still developing and the CLI tracks them, which is the right thing for it to do.
No prompt or response content is captured. The tailer reads metadata fields and drops message bodies, and I would leave OTEL_INSTRUMENTATION_GENAI_CAPTURE_MESSAGE_CONTENT alone against this stack, because my stack has no access control and would happily store your source code on a local port. Every port binds to 127.0.0.1. Keep it that way.
None of this is a benchmark. Twenty-four turns describes what the telemetry contains and proves the dashboard works. It is nowhere near enough to judge a routing policy, and the numbers above say nothing about model quality.
Why I think this pattern is worth stealing
Nothing here is broken. HydraFusion returns one coherent answer for a good reason, the CLI reports one credit figure for a good reason, and the OTel output is a faithful reading of a spec that is still growing into compound models. Every layer is behaving exactly as designed, and the detail I wanted turned out to be one file away.
That is the pattern worth taking with you. When an interface gives you a summary and you want the breakdown, the answer is usually not to wait for the interface to grow a new field. It is to go and find where the system already keeps its own notes, because most runtimes record far more than they display, for their own operational reasons. Resume and rewind is why this log exists, and routing visibility is a side effect I got for free.
I guessed the route right once in six tries, which says a good deal more about my rule of thumb than it does about the router. That is the entire argument for reading the log instead of reasoning about it.
The repo is samueltauil/hydrafusion-traces, the field notes are in docs/FINDINGS.md, and what the CLI actually emits is measured in docs/SPIKE.md.