Building an MCP App with Interactive Charts for VS Code
In this post, I’ll walk you through an MCP (Model Context Protocol) App that displays interactive charts directly in VS Code. This app demonstrates how to create rich UI experiences that integrate seamlessly with AI assistants like GitHub Copilot—and the best part? The entire codebase was generated by GitHub Copilot.
What is MCP?
The Model Context Protocol (MCP) is an open standard that enables AI models to interact with external tools and data sources. MCP Apps extend this by allowing servers to provide interactive UI components that render within the host application.
The Goal
The goal was to create an MCP server that:
- Accepts chart data from AI assistants
- Renders interactive charts (bar, line, pie, doughnut)
- Allows users to switch chart types dynamically
- Integrates with VS Code’s theming system
How It Was Built: GitHub Copilot + Custom Skill
Here’s the exciting part: all the code in this project was generated by GitHub Copilot using a custom skill designed specifically for building MCP Apps.
The skill teaches Copilot the patterns, APIs, and best practices for MCP App development:
With this skill enabled, I simply described what I wanted—”create an MCP server that displays interactive charts”—and Copilot generated the entire project: server setup, tool registration, React components, theme integration, and configuration files.
This is a great example of how custom skills can supercharge GitHub Copilot for domain-specific development tasks.
Project Setup
1. Scaffolding the Project
The project starts with a basic setup:
mkdir mcp-chart-app
cd mcp-chart-app
npm init -y
2. Installing Dependencies
The project uses several key dependencies:
npm install @modelcontextprotocol/ext-apps @modelcontextprotocol/sdk \
  chart.js react-chartjs-2 react react-dom express cors zod
Runtime Dependencies:
@modelcontextprotocol/ext-apps- MCP Apps SDK for building UI-enabled servers@modelcontextprotocol/sdk- Core MCP SDKchart.js+react-chartjs-2- Chart renderingreact+react-dom- UI frameworkexpress- HTTP serverzod- Schema validation
3. Project Structure
mcp-chart-app/
├── main.ts              # Entry point - starts the MCP server
├── server.ts            # Tool and resource registration
├── mcp-app.html         # HTML template
├── src/
│   ├── mcp-app.tsx      # React UI component
│   └── global.css       # Theme-aware styles
└── dist/                # Built output
Building the Server
Defining the Tool Schema
In server.ts, the input schema is defined using Zod:
import { z } from "zod";

const chartDatasetSchema = z.object({
  label: z.string().describe("Dataset label"),
  data: z.array(z.number()).describe("Array of numeric data values"),
  backgroundColor: z.union([z.string(), z.array(z.string())]).optional(),
  borderColor: z.string().optional(),
});

const chartInputSchema = z.object({
  chartType: z.enum(["bar", "line", "pie", "doughnut"]),
  title: z.string(),
  labels: z.array(z.string()),
  datasets: z.array(chartDatasetSchema),
});
Registering the Tool and Resource
The MCP Apps SDK provides helpers to register tools with UI capabilities:
import { registerAppTool, registerAppResource } from "@modelcontextprotocol/ext-apps/server";
import { McpServer } from "@modelcontextprotocol/sdk/server/mcp.js";

export function createServer(): McpServer {
  const server = new McpServer({
    name: "MCP Chart App Server",
    version: "1.0.0",
  });

  const resourceUri = "ui://display-chart/mcp-app.html";

  // Register the tool with UI metadata
  registerAppTool(
    server,
    "display-chart",
    {
      title: "Display Chart",
      description: "Displays an interactive chart with the provided data",
      inputSchema: chartInputSchema.shape,
      _meta: { ui: { resourceUri } },
    },
    async (args) => {
      // Process and return chart data
      return {
        content: [{ type: "text", text: JSON.stringify(args) }],
      };
    }
  );

  // Register the UI resource
  registerAppResource(
    server,
    resourceUri,
    resourceUri,
    { mimeType: "text/html" },
    async () => {
      const html = await fs.readFile("dist/mcp-app.html", "utf-8");
      return {
        contents: [{ uri: resourceUri, mimeType: "text/html", text: html }],
      };
    }
  );

  return server;
}
Building the React UI
The UI component uses the MCP Apps React hooks:
import { useApp, useHostStyles } from "@modelcontextprotocol/ext-apps/react";
import { Bar, Line, Pie, Doughnut } from "react-chartjs-2";

function ChartApp() {
  const [chartData, setChartData] = useState(null);

  const { app, error } = useApp({
    appInfo: { name: "Chart Display App", version: "1.0.0" },
    onAppCreated: (app) => {
      app.ontoolresult = async (result) => {
        const data = JSON.parse(result.content[0].text);
        setChartData(data);
      };
    },
  });

  // Apply host theme styles
  useHostStyles(app);

  // Render chart based on type...
}
Theme Integration
The CSS uses CSS variables that automatically adapt to the host’s theme:
.main {
  background: var(--color-background-primary, #ffffff);
  color: var(--color-text-primary, #1f2937);
}

.chart-container {
  border: 1px solid var(--color-border-primary, #e5e7eb);
  border-radius: var(--border-radius-lg, 12px);
}
Running the Server
Local Development
npm run dev
This starts the server on http://localhost:3001/mcp with hot-reload.
Exposing Publicly with Cloudflared
For testing with remote clients or demos, you can use Cloudflare Tunnel to expose the local server:
# Install cloudflared
winget install --id Cloudflare.cloudflared  # Windows
brew install cloudflared                     # macOS

# Run server with tunnel
npm run public
This provides a public URL like https://random-subdomain.trycloudflare.com.
Configuring in VS Code
Method 1: Settings JSON
Add to your VS Code settings.json:
{
  "mcp": {
    "servers": {
      "chart-app": {
        "url": "https://your-tunnel-url.trycloudflare.com/mcp"
      }
    }
  }
}
Method 2: MCP: Add Server Command
- Press
Ctrl+Shift+P(orCmd+Shift+Pon macOS) - Type “MCP: Add Server”
- Choose “HTTP” transport
- Enter a name:
chart-app - Paste the URL:
https://your-tunnel-url.trycloudflare.com/mcp
Using the Chart App
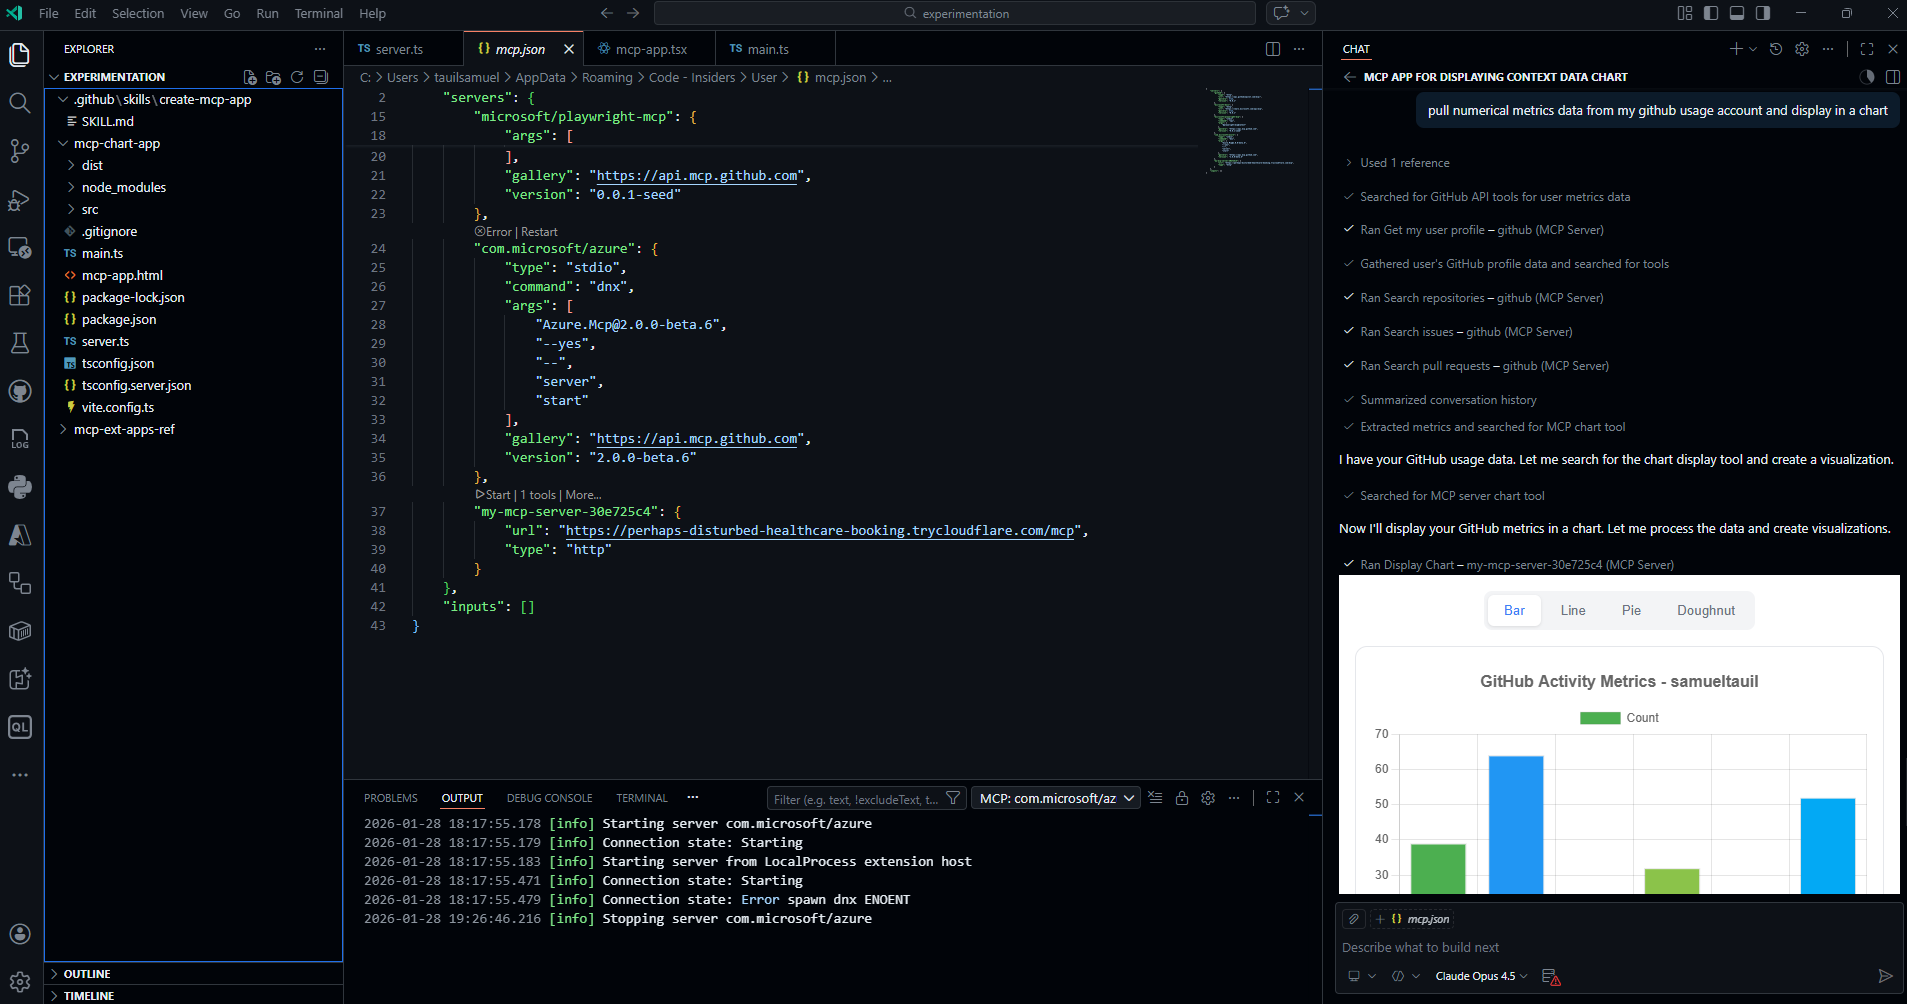
Once configured, open GitHub Copilot Chat and try prompts like:
“Pull data from my GitHub account usage metrics and display in a pie chart”
Note: This example requires the GitHub MCP Server to also be configured. The GitHub MCP Server retrieves the data, and then the Chart App visualizes it. This demonstrates how multiple MCP servers can work together—one for data retrieval, another for presentation.
Example Tool Call
The AI will call the display-chart tool with data like:
{
  "chartType": "pie",
  "title": "GitHub Usage Metrics",
  "labels": ["Commits", "Pull Requests", "Issues", "Reviews"],
  "datasets": [{
    "label": "Activity",
    "data": [142, 38, 25, 67]
  }]
}
The chart renders interactively in VS Code, and you can switch between chart types (bar, line, pie, doughnut) without re-invoking the tool.
Key Takeaways
-
MCP Apps enable rich UIs - Beyond text responses, MCP servers can provide interactive visual components.
-
Theme integration is seamless - CSS variables automatically adapt to VS Code’s light/dark themes.
-
Multiple transports supported - HTTP for development/demos, stdio for production integrations.
-
MCP servers compose well - Combine data-fetching servers (like GitHub MCP) with visualization servers (like this Chart App) for powerful workflows.
Resources
Have questions or want to see more MCP tutorials? Reach out on GitHub!